How Internet Blackouts Work—and How Researchers Measure Them
A guide to routing withdrawals, traffic drops, DNS interference, filtering, throttling, measurement vantage points, and cautious attribution.
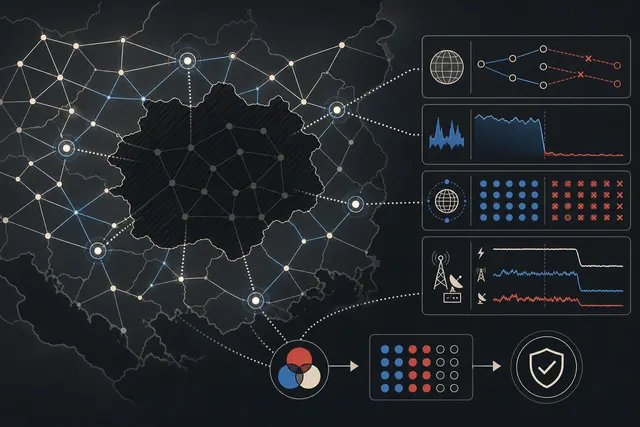
An internet blackout is rarely observed by one perfect sensor. A country can disappear from one traffic graph while some networks remain connected. A messaging service can fail even though ordinary websites work. Routes can stay visible while packets are filtered. A power failure can resemble a directed shutdown.
Researchers therefore combine several kinds of evidence: routing announcements, traffic volume, active probes, DNS and application tests, and reports from people and network operators. Each observes a different layer and each has blind spots.
The responsible conclusion is often narrower than a headline. Measurements can establish that connectivity changed, where and when it changed, and which mechanisms are consistent with the data. Intent and responsibility usually require corroborating evidence.
“Blackout” covers several different events
A useful investigation begins by defining what became unavailable.
- A total shutdown disconnects most networks or users in a geographic area.
- A regional shutdown affects selected provinces, cities, or access networks.
- A mobile-data shutdown leaves fixed broadband or institutional links operating.
- Platform blocking targets services such as messaging, social media, news, VPNs, or Tor.
- Throttling degrades performance enough to make services unreliable without removing all connectivity.
- Routing failure makes address space unreachable because paths disappear or are misdirected.
- DNS interference returns false answers, errors, or no answer for selected names.
- Protocol or address filtering blocks connections based on IP, port, TLS metadata, HTTP fields, or traffic patterns.
These events can overlap. A government order may be implemented differently by several providers. An operator mistake, damaged cable, power loss, or attack can produce similar symptoms.
BGP shows whether networks advertise paths
The Border Gateway Protocol lets autonomous systems announce which IP prefixes they can reach and how other networks can route traffic toward them. Route collectors observe a sample of those announcements from participating networks.
If many prefixes from a country or provider are withdrawn at the same time, external observers may lose routes to those networks. That is strong evidence of a routing-level disruption. It does not show whether every user is offline, why the change occurred, or whether filtering continues behind routes that remain visible.
BGP visibility is also shaped by collection points. A route may appear differently to different peers. Researchers should examine multiple collectors, affected prefixes, origin networks, start and end times, and whether alternative paths appeared.
Cloudflare’s Radar glossary explains that BGP announcements expose route and address-space visibility, while outage detection also uses traffic anomalies and corroboration. Routing is one signal, not a universal outage detector.
Traffic drops reveal lost activity
Large networks and service providers can compare current request or byte volume with historical patterns for a location or autonomous system. A sudden, sustained drop at an unusual time is an early signal of disruption.
Traffic has strong daily and weekly cycles. Holidays, weather, major events, changes in customer mix, measurement outages, and shifts to another provider can alter it. Normalization and a well-chosen baseline matter.
Cloudflare states that its Radar outage entries represent notable traffic drops generally corroborated with third-party information. It distinguishes algorithmically detected anomalies from verified outage events. Its documentation also lists multiple possible causes, including power failures, cable damage, weather, disasters, and government-directed shutdowns.
A traffic graph describes what one network can observe. It may underrepresent regions or providers with little traffic through that network. A percentage drop in a provider’s traffic cannot automatically be converted into the same percentage of a country’s population offline.
Active probes test reachability from known locations
An active measurement platform sends controlled queries from distributed devices. Ping can test packet reachability, traceroute can show path changes, DNS queries can compare resolver behavior, and TLS or HTTP tests can examine higher layers.
RIPE Atlas uses volunteer-hosted probes and higher-capacity anchors to run ping, traceroute, DNS, TLS, NTP, and limited HTTP measurements. Its measurement documentation describes how tests are defined and results retrieved.
Probe evidence has a sampling problem. A country may contain many users but only a few active probes. Probes are not randomly distributed, and a probe going offline may mean lost power, a home-router problem, or platform maintenance rather than a national shutdown.
Researchers should report how many probes were eligible, which networks and regions they represented, how many stopped reporting, and whether probes outside the affected area could still reach targets inside it.
Application tests detect selective blocking
Country-wide traffic and BGP data can look normal while selected sites or apps are blocked. Measuring this requires tests from inside affected networks.
The Open Observatory of Network Interference publishes open-source tests and public measurements. Its network tests can examine website blocking through DNS, TCP/IP, or transparent HTTP interference, along with reachability of messaging services, Tor, circumvention tools, and network performance.
A typical web-connectivity test compares observations from the local network with a control perspective. Differences in DNS answers, connection behavior, TLS negotiation, or HTTP responses can indicate interference.
An anomaly is not automatically censorship. Websites change, geoblock users, reject automated clients, experience outages, or use different infrastructure by region. Reliable analysis looks for repeated measurements, consistent failure signatures, multiple networks, known block pages, and control tests.
OONI describes itself as a decentralized project that publishes measurements as open data and uses them as potential evidence. Its about page also directs users to read its data policy and potential-risk documentation. Running censorship tests can expose which sites are being tested to a local network, which may create personal risk in some jurisdictions.
DNS evidence needs packet-level context
DNS interference may appear as an unexpected IP address, an error such as NXDOMAIN, a timeout, or inconsistent results between resolvers. But content-delivery networks legitimately return different addresses based on location, and resolver policy can block malware or adult content.
Compare the same name across local and independent resolvers, repeat the query over encrypted and unencrypted transports when safe, inspect DNSSEC validation where available, and test direct connections to known service addresses. Preserve timestamps, resolver addresses, query types, and raw answers.
Changing to a public resolver bypasses only some forms of interference. A network can redirect port 53 traffic, block the public resolver, filter its IP addresses, interfere with encrypted DNS endpoints, or block the destination after name resolution succeeds.
Throttling is harder to prove than blocking
Performance can deteriorate because of congestion, weak radio coverage, overloaded servers, damaged infrastructure, traffic shaping, or intentional throttling. A single speed test cannot distinguish them.
A stronger analysis uses repeated tests over time, several destinations and protocols, comparison networks, and metrics beyond download throughput:
- latency and jitter;
- packet loss;
- connection setup success;
- time to first byte;
- sustained throughput at different times;
- performance to domestic and international targets;
- differences between services with similar technical demands.
If one platform becomes slow while comparable services remain normal across the same access networks, selective interference becomes more plausible. If all destinations degrade during peak hours, congestion may be a better explanation.
Power and physical infrastructure leave different clues
A widespread power failure can take access networks, cell towers, customer routers, and probes offline together. Fiber damage may isolate a region while local services remain reachable. A submarine cable failure may shift traffic onto slower paths without creating a full blackout.
Correlate network signals with grid reports, weather, disasters, cable status, provider notices, and changes in traceroute paths. The absence of a public explanation is not proof of state action.
Physical events and policy can also interact. Authorities may order shutdowns during unrest that already affects power and infrastructure. Measurements should separate concurrent mechanisms where possible.
A defensible investigation workflow
For a suspected disruption:
- Record the claim, location, providers, affected services, and time zone.
- Establish a baseline covering comparable hours and days.
- Check BGP visibility and route changes across multiple collectors.
- Compare traffic trends from more than one large observer when available.
- Examine active probes by network and region, not only national totals.
- Run or inspect application-level tests for selective blocking.
- Preserve raw DNS, TCP, TLS, HTTP, ping, and traceroute results.
- Look for power, cable, weather, provider, and platform incidents.
- Corroborate with local reports while protecting vulnerable sources.
- State confidence, alternative explanations, coverage gaps, and the precise period measured.
Time alignment is essential. Convert datasets to UTC and preserve their original resolution. A five-minute traffic bucket, a BGP update, and a user’s local timestamp should not be treated as simultaneous without checking boundaries and clock accuracy.
How to word conclusions accurately
Evidence can support different levels of claim:
- “Traffic observed by provider X fell sharply” describes one dataset.
- “Several networks lost external reachability” combines route or probe evidence.
- “Measurements are consistent with DNS-based blocking of service Y” identifies a mechanism without overstating intent.
- “Multiple independent datasets indicate a national connectivity disruption” is stronger but still does not identify who caused it.
- “Authorities ordered the shutdown” requires a directive, provider confirmation, credible reporting, or equivalent evidence beyond network telemetry.
Avoid converting “no measurements” into “no internet.” Measurement systems can fail, lose volunteers, or have sparse coverage. Also avoid using national averages to erase communities that remain disconnected after most traffic returns.
Why multiple signals matter
No single dataset sees the internet. BGP collectors observe advertised routes. Large providers observe traffic that reaches their infrastructure. Active probes observe paths from specific networks. Application tests reveal protocol-level interference from participating devices. People on the ground observe practical consequences and local instructions.
When those sources change at the same time and tell a compatible story, confidence rises. When they disagree, the disagreement is information: the event may be regional, provider-specific, protocol-specific, or below the resolution of one sensor.
Measuring an internet blackout is therefore less like checking one switch and more like reconstructing an incident from partial instruments. The best reports preserve raw evidence, expose limitations, distinguish disruption from attribution, and remain open to revision as new vantage points appear.