What AI Data Centers Consume—and What the Numbers Leave Out
How to read claims about electricity, peak power, water, emissions, hardware, and grid impact without turning uncertain system estimates into per-prompt facts.
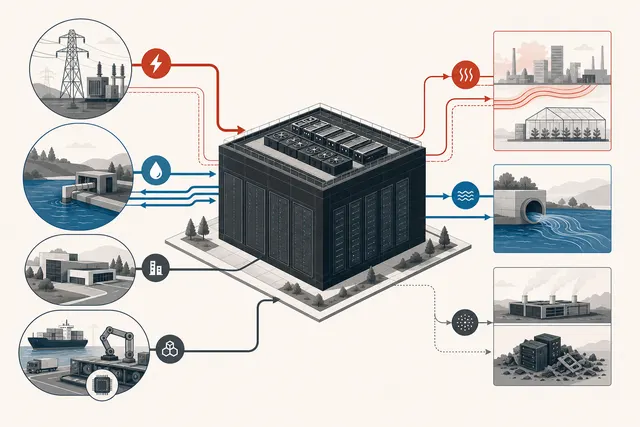
AI does not consume electricity or water in isolation. Models run on servers inside facilities that also contain networking, storage, power conversion, cooling, backup systems, and idle capacity. Those facilities draw from local grids whose generation mix changes by place and hour. Manufacturing the chips and buildings creates impacts before the first prompt arrives.
This makes a universal “cost per AI query” attractive and usually misleading. The answer depends on the model, hardware, utilization, response length, serving method, facility, grid, cooling system, weather, and accounting boundary.
A useful analysis keeps the units and boundaries visible.
Energy and power answer different questions
Energy is accumulated consumption, commonly measured in kilowatt-hours, megawatt-hours, or terawatt-hours. Power is the rate of consumption at a moment, measured in kilowatts, megawatts, or gigawatts.
A data center can use the same annual energy as another facility while creating a harder local grid problem if its peak demand is higher, less flexible, or concentrated behind constrained transmission. Conversely, a large connection reservation does not prove that a facility continuously consumes its full nameplate capacity.
Reports should distinguish:
- requested or contracted connection capacity;
- installed IT capacity;
- measured peak facility demand;
- average load and load factor;
- annual electricity consumption;
- projected rather than operating load.
The IEA Energy and AI report estimates that data centers used roughly 1.5% of global electricity in 2024 and projects substantial growth through 2030. It also stresses geographic concentration: local grid effects can be significant even when the global share remains modest.
“Data center” is not identical to “AI”
Facilities also host conventional cloud applications, storage, databases, content delivery, streaming, enterprise systems, cryptocurrency workloads, and network services. Even an AI-focused cluster may train models, serve inference, preprocess data, run evaluations, and support non-AI control systems.
Attributing facility electricity to AI requires workload classification or a model of equipment shipments and utilization. Public estimates often combine categories because operators do not disclose enough detail.
The 2024 Lawrence Berkeley National Laboratory report uses historical and equipment-shipment information to estimate U.S. data-center electricity and model a range through 2028. A range is appropriate because equipment mix, utilization, efficiency, and deployment growth are uncertain.
When citing a forecast, preserve its publication date, geography, scenario, endpoint, and range. Do not combine the top of one scenario with the assumptions of another.
The facility overhead matters
Servers are not the only electrical load. Cooling, pumps, fans, power distribution, uninterruptible power supplies, lighting, and other infrastructure consume energy.
Power Usage Effectiveness, or PUE, is the ratio of total facility energy to IT-equipment energy. A PUE of 1 would mean no facility overhead, which real facilities cannot achieve. A lower PUE generally indicates less overhead, but it does not measure useful computing work, grid emissions, water stress, or hardware manufacturing.
PUE can also obscure trade-offs. Evaporative cooling may reduce electricity use while consuming more water. A facility may report an efficient annual average while stressing the grid during specific hours. Comparisons need the same boundary, climate, load, and measurement method.
Utilization is equally important. Accelerators reserved for bursts or reliability can draw power while doing little useful work. Batching, quantization, caching, speculative decoding, model routing, and better scheduling can reduce energy per completed task without changing the building’s PUE.
Per-query numbers require a complete denominator
To calculate energy per query, divide attributable energy by a clearly defined number of completed requests or units of useful work. That sounds simple until the workload varies.
A short classification, long document analysis, image generation, video generation, agent workflow, and reasoning search are not comparable requests. Response length and repeated tool calls can change computation by orders of magnitude. Failed and retried requests still consume resources.
At minimum, a per-query disclosure should state:
- model and serving configuration;
- input and output size distribution;
- hardware and precision;
- batching and utilization assumptions;
- whether idle and reserved capacity are allocated;
- whether networking, storage, cooling, and power losses are included;
- the time period and fleet scope;
- whether training, fine-tuning, and evaluation are excluded;
- whether the number is measured, sampled, or modeled.
Google’s paper on measuring the environmental impact of AI serving is useful as an accounting example because it contrasts a narrow accelerator-only approach with a broader method that includes idle capacity, host CPUs and memory, and facility overhead. Its result describes a median text prompt for one product and month; it should not be generalized to every model, provider, or task.
Electricity emissions depend on when and where
Multiplying electricity by one emissions factor creates an estimate, not a physical measurement of each request’s emissions.
Location-based accounting uses the generation mix associated with the grid. Market-based accounting incorporates contractual instruments such as power-purchase agreements and certificates. Both answer policy-relevant questions, but they are not interchangeable.
Hourly matching matters when renewable production and computing demand occur at different times. An annual contract for as much renewable energy as a facility consumes does not mean every operating hour is physically supplied by carbon-free generation.
The IEA’s energy-supply analysis distinguishes the fuel mix physically supplying data centers from operators’ contractual procurement. Reports should say which perspective they use.
Also separate operational electricity emissions from embodied emissions in servers, buildings, cooling equipment, backup generation, and grid infrastructure. Faster hardware replacement may improve serving efficiency while increasing manufacturing impacts.
Water has several boundaries
Data centers may consume water directly for cooling. Electricity generation may also consume or withdraw water away from the site. Semiconductor manufacturing and construction add further upstream demands.
Withdrawal is water taken from a source; consumption is the portion not returned to the same watershed in a usable form, often because it evaporates. Those numbers should not be mixed.
Water Usage Effectiveness typically relates annual site water consumption to IT energy. Like PUE, it needs context. A liter consumed in a water-stressed basin during a drought does not have the same local consequence as a liter in a water-abundant region.
The U.S. Department of Energy’s cooling-water guidance explains the heat path through common chilled-water and cooling-tower systems and defines site-based water usage effectiveness. It also describes operational changes that can reduce cooling demand.
Air cooling can reduce direct water use but may use more electricity under some conditions. Reclaimed water can reduce competition for potable supplies but still has infrastructure and treatment requirements. The right comparison includes energy, water source, season, watershed stress, and reliability.
Grid impact is local and temporal
Large data centers can be built faster than generation, transmission, substations, and transformers. A project may therefore affect interconnection queues, reliability planning, tariffs, and who pays for upgrades.
Key questions include:
- Is the load already operating, under construction, speculative, or merely requested?
- Which substation and transmission constraints apply?
- Does the facility add generation or only purchase energy claims?
- Can work shift by minutes or hours during grid stress?
- Are backup generators included in emissions and air-quality permits?
- Who bears infrastructure and stranded-asset risk if demand changes?
- Does the tariff protect other customers from cost shifting?
Data centers often seek continuous availability, but some computation may be schedulable. Training checkpoints, batch processing, and non-urgent evaluation can sometimes shift; user-facing inference and tightly coordinated clusters may be less flexible. Claims about flexibility should specify the workload and tested response time.
Efficiency can reduce unit cost and raise total demand
Hardware and software efficiency can lower energy per token or task. That does not guarantee lower total electricity use. Cheaper computation may increase adoption, response length, model scale, generated media, agent activity, or the number of experiments.
This rebound effect is one reason to track both intensity and totals:
- joules or watt-hours per defined task;
- tasks per accelerator-hour;
- annual facility and fleet electricity;
- peak power;
- direct and upstream water;
- operational and embodied emissions.
An efficiency announcement without total demand reveals only part of the impact. A total-demand forecast without efficiency scenarios also hides important uncertainty.
Forecasts are scenarios, not promises
AI electricity forecasts depend on adoption, model architecture, hardware shipments, utilization, efficiency, construction, grid connections, and economic conditions. Small changes compound over several years.
The IEA publishes multiple sensitivity cases rather than one inevitable future. The LBNL report similarly presents a range. Good reporting shows that range and explains which assumptions move it.
Beware of double counting. Interconnection queues contain projects that may never be built. Announced facilities may overlap. Vendor revenue, chip shipments, floor area, nameplate capacity, and electricity consumption measure different things and cannot simply be added.
A better disclosure template
For a facility or provider, useful public reporting would include:
- Monthly facility energy and peak power by region.
- IT energy, PUE, utilization, and measurement coverage.
- AI workload share with a documented classification method.
- Direct water withdrawal and consumption by source and watershed.
- Location-based and market-based emissions, plus hourly matching where available.
- Backup generation use and local air emissions.
- Hardware embodied impacts and replacement assumptions.
- Efficiency per defined workload, including input and output distributions.
- Grid interconnection status, added supply, and tested flexibility.
- Historical values, revisions, uncertainty, and independent assurance.
For one AI task, the provider should publish a distribution rather than only a median. A median hides heavy requests that may dominate total use.
How to read the next headline
When a claim says AI uses a particular amount of electricity or water, ask:
- Is this one query, model, facility, company, country, or the whole sector?
- Is it power or energy?
- Is the value measured, allocated, or projected?
- Which workloads and infrastructure are included?
- Does water mean withdrawal or consumption, direct or upstream?
- Are emissions location-based or market-based?
- Is the figure an average, median, peak, or scenario range?
- What year, region, and technology does it describe?
AI infrastructure has real and rapidly changing resource demands. The honest way to describe them is not to force every impact into one viral number. It is to preserve boundaries, measure local constraints, publish uncertainty, and compare useful work with the full system that delivers it.